Description
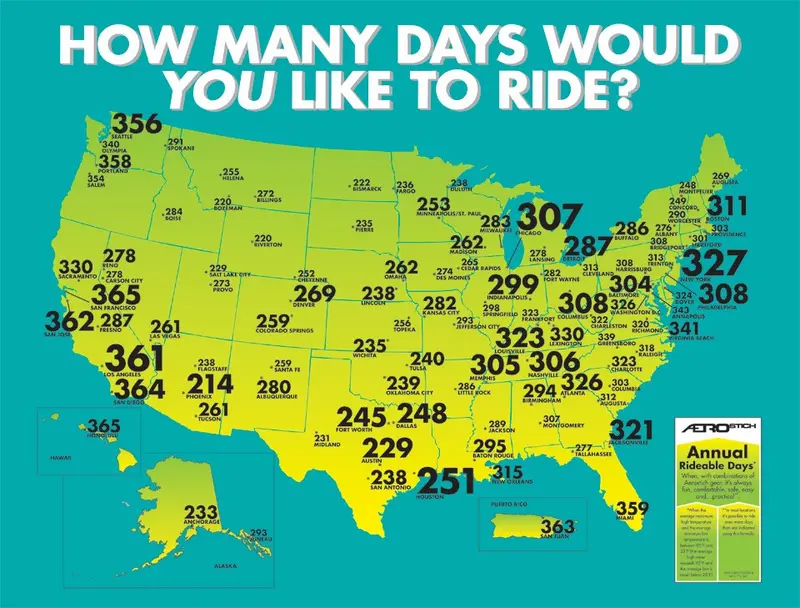
How many days would you like to ride? Based on a formula that includes selected ambient temperature ranges when riding with Aerostich gear, this colorful map portrays a fascinating representation of the annual number of rideable days easily achievable annually throughout the United States. 38″×26″
ABOUT THIS MAP…
Statistics for the average daily and seasonal temperatures in thousands of locations are available from the US Department of Agriculture to help farmers know what kinds of crops to plant and when to harvest.
The different sizes of the numbers on the map correspond to the populations of the cities listed. In other words, a large number like Los Angeles have a lot of people, and the average low and high temps used by this formula are seldom exceeded there, so this city has lots of ridable days. In contrast, cities like Phoenix AZ and Duluth MN each have different size numbers based on their differing populations, but similarly few ridable days because in those places so many days are by this formula on average either too hot or too cold.
The high and low temperatures used (95°F and 25°F / 35°C and -3.8°C) are based on the temperatures which are easy to dress for with Aerostich gear. It’s always been comparatively simple to ride through temperatures between 95°F and 25°F over urban distances.
– Mr. Subjective, 1-14
Explore more from our collection.
Reviews
There are no reviews yet.